West Yorkshire Rider and Bike Stats
Part of what we do is understanding what local transport policies there are, how they affect transport in general, and what the implications are for motorbikes. Some of this comes fairly easily through things like press releases and the local papers. Other times it involves digging a bit further and doing some research. In November last year we put out a Freedom of Information Act request to DVLA to find out more about the number of bikes and riders there are locally. This can be found at https://www.whatdotheyknow.com/request/motorcycle_and_rider_stats_for_w.
The first bit we asked about is the number of people holding various types of licence, broken down by postcode area and year. We also asked if they had any figures for the number of people holding a DL196 CBT certificate. The nature of the DVLA database means they could only give us a snapshot of licence types rather than historical figures. Also they don’t record how many people have a CBT. This means they don’t know how many riders with a provisional licence there are which has implications for licencing policy.
The figures that we do have are as follows. They are broken down by the 6 postcode areas in West Yorkshire: BD, HD, HX, LS, OL14 and WF. They don’t correspond exactly to district boundaries. BD covers Skipton and Settle. HD includes Brighouse which is in Calderdale. LS includes Tadcaster and Sherbourne in Elmet (where Squires is!). OL14 is the postcode are for Todmorden where your webmaster has friends and family. Some parts of WF are in Kirklees. With these provisos in mind, here’s the figures:
| Class | BD | HD | HX | LS | OL14 | WF | Grand Total |
| A | 23,157 | 13,571 | 8,571 | 32,549 | 964 | 27,005 | 105,817 |
| A2 | 139 | 71 | 50 | 190 | 6 | 157 | 613 |
| AR2 | 67 | 59 | 37 | 142 | 1 | 103 | 409 |
| A1 | 135 | 69 | 40 | 290 | 5 | 92 | 631 |
| Total | 23,498 | 13,770 | 8,698 | 33,171 | 976 | 27,357 |
Class AR2 covers people with an A2 licence who will be upgraded to A when they next apply for a new licence. A1 includes AM moped entitlement. LS is obviously a much bigger area than OL14 so of course there will be more riders there. Courtesy of http://www.nomisweb.co.uk/census/2011/ks101ew we can get the population for each of these areas and work out the rate of ridership:
| Area | BD | HD | HX | LS | OL14 | WF |
| Population (2011) | 578,336 | 262,814 | 160,378 | 774,180 | 15,481 | 512,657 |
| Licence holders | 23,498 | 13,770 | 8,698 | 33,171 | 976 | 27,357 |
| Rate | 4.06% | 5.24% | 5.42% | 4.28% | 6.30% | 5.34% |
The average rate for all these areas is 5.11%. BD and LS have somewhat better bus services than the other areas which might explain why they’re below average.
The next set of figures we got are for the number of registered motorbikes in each postcode area. Unlike the rider stats we were able to get them broken down by both postcode area and year. This covers all bikes including learner legal ones and mopeds. Those numbers look like this:
| 2005 | 2006 | 2007 | 2008 | 2009 | 2010 | 2011 | 2012 | 2013 | 2014 | 2015 | 2016 | 2017 | |
| BD | 7051 | 6990 | 7341 | 7246 | 7246 | 6906 | 6828 | 6697 | 6624 | 6532 | 6649 | 6728 | 6583 |
| EXEMPT | 870 | 845 | 855 | 845 | 817 | 853 | 844 | 833 | 908 | 918 | 958 | 983 | 998 |
| STANDARD | 6181 | 6145 | 6486 | 6401 | 6429 | 6053 | 5984 | 5864 | 5716 | 5614 | 5691 | 5745 | 5585 |
| HD | 4528 | 4486 | 4681 | 4696 | 4695 | 4507 | 4514 | 4422 | 4361 | 4430 | 4494 | 4569 | 4414 |
| EXEMPT | 474 | 490 | 475 | 470 | 500 | 501 | 513 | 522 | 559 | 586 | 593 | 621 | 642 |
| STANDARD | 4054 | 3996 | 4206 | 4226 | 4195 | 4006 | 4001 | 3900 | 3802 | 3844 | 3901 | 3948 | 3772 |
| HX | 2914 | 2893 | 2896 | 2910 | 2875 | 2692 | 2755 | 2716 | 2697 | 2656 | 2636 | 2650 | 2640 |
| EXEMPT | 294 | 286 | 275 | 287 | 287 | 281 | 279 | 287 | 294 | 305 | 301 | 330 | 350 |
| STANDARD | 2620 | 2607 | 2621 | 2623 | 2588 | 2411 | 2476 | 2429 | 2403 | 2351 | 2335 | 2320 | 2290 |
| LS | 9991 | 9884 | 10109 | 10133 | 10098 | 9868 | 9799 | 9700 | 9666 | 9670 | 9800 | 9870 | 9677 |
| EXEMPT | 1171 | 1186 | 1165 | 1176 | 1167 | 1187 | 1172 | 1181 | 1224 | 1227 | 1262 | 1285 | 1294 |
| STANDARD | 8820 | 8698 | 8944 | 8957 | 8931 | 8681 | 8627 | 8519 | 8442 | 8443 | 8538 | 8585 | 8383 |
| WF | 9824 | 9770 | 10007 | 10129 | 10021 | 9498 | 9652 | 9585 | 9514 | 9672 | 9661 | 9775 | 9874 |
| EXEMPT | 951 | 919 | 935 | 959 | 976 | 968 | 997 | 981 | 1059 | 1106 | 1128 | 1216 | 1243 |
| STANDARD | 8873 | 8851 | 9072 | 9170 | 9045 | 8530 | 8655 | 8604 | 8455 | 8566 | 8533 | 8559 | 8631 |
| OL14 | 300 | 304 | 332 | 342 | 360 | 322 | 288 | 284 | 269 | 293 | 297 | 311 | 310 |
| EXEMPT | 47 | 41 | 42 | 47 | 42 | 42 | 45 | 42 | 48 | 50 | 49 | 46 | 46 |
| STANDARD | 253 | 263 | 290 | 295 | 318 | 280 | 243 | 242 | 221 | 243 | 248 | 265 | 264 |
| Grand Total | 34608 | 34327 | 35366 | 35456 | 35295 | 33793 | 33836 | 33404 | 33131 | 33253 | 33537 | 33903 | 33498 |
“Exempt” bikes cover the following:
- Tax class 61: these are records where there has been no activity for some considerable time.
- Motorcycles on the DVLA off road register.
- Tax class 88: These are vehicles over forty years old and deemed to be historic.
The interesting figures are the “standard” ones. It’s impossible to tell how many people own more than one bike but they give a good idea of how many are in use. As a graph it looks like this:
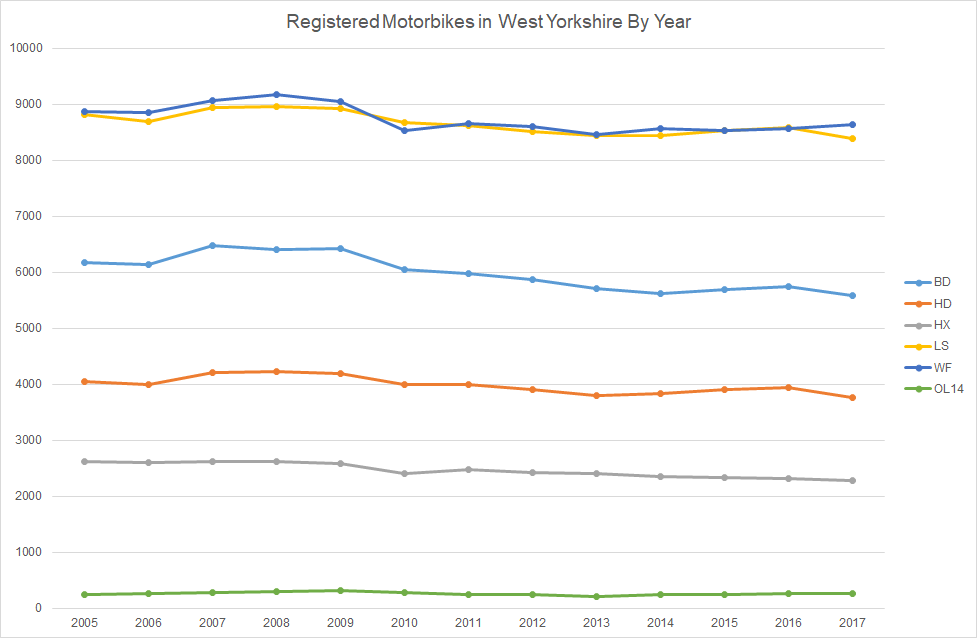
The 2 part motorbike test was introduced in 2009 which probably put people off a bit. It was also when the Credit Crunch was starting to bite. In 2013 the automatic upgrade to the next licence category after riding for 2 years was removed. There was a slight rise in 2016 followed by a fall in 2017 which is probably due to the economic slowdown caused by the uncertainty over Brexit.
To put this in context, we need some figures from the Department for Transport to see how it compares to other forms of transport. https://www.dft.gov.uk/traffic-counts/area.php?region=Yorkshire+and+the+Humber has traffic counts for all local authorities in the Yorkshire and Humber area. Because we’re Leeds MAG the figures for our area look like this:
| Year | 2000 | 2001 | 2002 | 2003 | 2004 | 2005 | 2006 | 2007 | 2008 | 2009 | 2010 | 2011 | 2012 | 2013 | 2014 | 2015 | 2016 | 2017 |
| Pedal Cycles | 3,909 | 4,229 | 3,847 | 4,483 | 3,565 | 2,800 | 3,769 | 3,813 | 4,926 | 5,415 | 5,254 | 5,799 | 6,204 | 6,153 | 5,975 | 5,828 | 6,373 | 6,368 |
| Motorcycles | 13,024 | 11,515 | 13,353 | 14,988 | 12,689 | 13,027 | 12,374 | 13,007 | 13,832 | 13,932 | 13,016 | 12,362 | 11,072 | 11,995 | 11,896 | 11,954 | 11,694 | 11,087 |
| Cars | 1,946,307 | 1,967,208 | 2,003,759 | 2,024,854 | 2,074,952 | 2,032,349 | 2,069,628 | 2,073,040 | 2,063,675 | 2,021,286 | 2,001,089 | 2,011,265 | 1,978,811 | 1,974,540 | 2,038,877 | 2,117,991 | 2,243,926 | 2,275,760 |
| Buses & Coaches | 21,700 | 22,594 | 21,913 | 21,741 | 20,965 | 21,689 | 22,964 | 21,425 | 21,007 | 20,653 | 20,497 | 19,230 | 19,375 | 19,367 | 19,428 | 18,874 | 17,185 | 16,277 |
| Light Goods Vehicles | 280,453 | 291,683 | 304,362 | 322,695 | 348,234 | 353,573 | 360,879 | 377,666 | 373,098 | 357,241 | 361,616 | 373,347 | 357,839 | 363,054 | 381,305 | 402,109 | 433,634 | 439,919 |
| All HGVs | 209,134 | 202,621 | 205,498 | 206,231 | 218,023 | 212,086 | 210,723 | 209,818 | 210,706 | 185,591 | 185,508 | 187,942 | 186,079 | 191,599 | 206,607 | 220,582 | 223,862 | 220,644 |
These numbers are the number of vehicles passing certain count points. More details can be found on the DfT website. As a graph it looks like this:
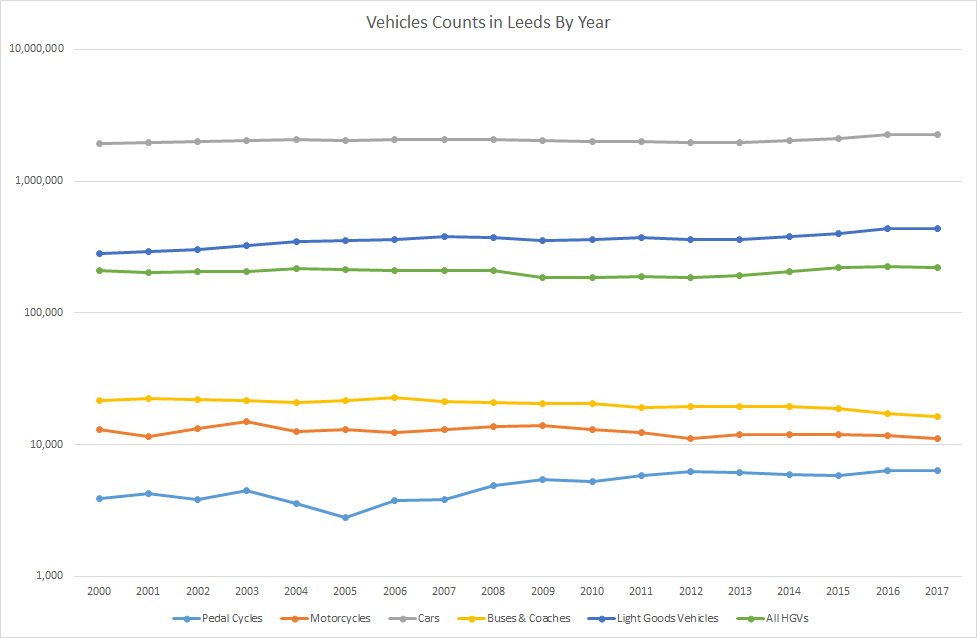
Due to the much greater number of cars this graph has a logarithmic scale starting at 1000 to make the differences stand out. Cars, LGVs and HGVs have risen. Pedal cycles have also increased, which is not a surprise given how heavily Leeds council has promoted cycling. Motorbikes have fluctuated pretty much in line with the number of registered bikes in the much larger LS postcode area and there are at least 5000 more movements than pedal bikes. Bus use has fallen (note: this is the number of vehicles, not a count of the people using them). Leeds council has also been promoting bus use very aggressively over the years but the only rise was in 2007 when free travel for over 65s was introduced. If it continues to fall this will have serious implications for the policy of taking road space away from other vehicles to give buses priority. People would rather sit in congestion in their own cars or catch the train than use buses.
What does all this mean for motorbikes? First, despite all the warnings of doom and gloom, motorbike usage has been pretty stable over the years. We don’t know how the number of riders has changed over the years and DVLA doesn’t know how many people have taken a CBT but we do know that the number of registered bikes hasn’t changed very much. This is despite changes to the licensing regime and official apathy towards them. A lot of the arguments for using pedal bikes to reduce congestion also apply to motorbikes. They take up less road space than cars and are more flexible than buses.
This is one of the first pieces of research that Leeds MAG has done. Hopefully it’s interesting. We have a couple more Freedom of Information Act requests in the pipeline asking Leeds council for more details about their bus lane policy and trying to get to the bottom of allowing motorbikes in bus lanes. More to come when we get it.